Example: Store Payment Data in a Table and Analyze It
An example of pulling payment records through the Stripe connector into a table (a SQL dataset) and analyzing them in natural language. Suited to data that has grown past what a workbook sheet handles comfortably.
Payments keep arriving. Pasting them into one sheet makes the file heavy, and every question about customer totals or monthly trends means writing new formulas.
In a table, the data stays fast to open at tens of thousands of rows, and you can ask things like “group last quarter’s refunds by customer” whenever you need them.
Before
Export CSV from the Stripe dashboard → paste into Excel → write formulas
After
Load into a table through the connector → ask in chat
Prerequisite: Connect Stripe
Open Integration Settings
Go to User menu → Settings → Integrations.
Register the Secret Key
Find Stripe in the list, click Connect, and paste the secret key (sk_live_...) from Developers → API keys in your Stripe dashboard.

Step 1: Load Payment Data into a Table
Send it straight to a table rather than a workbook sheet. Tell the agent which columns to keep and it creates the table and fills it.
"Create a payments table from the last 12 months of Stripe charges.
Columns: charge date, customer email, customer name, amount, currency, status, failure reason."
The agent pulls the data from Stripe, creates the table, and inserts the rows. Open the table from the sidebar to see the result.
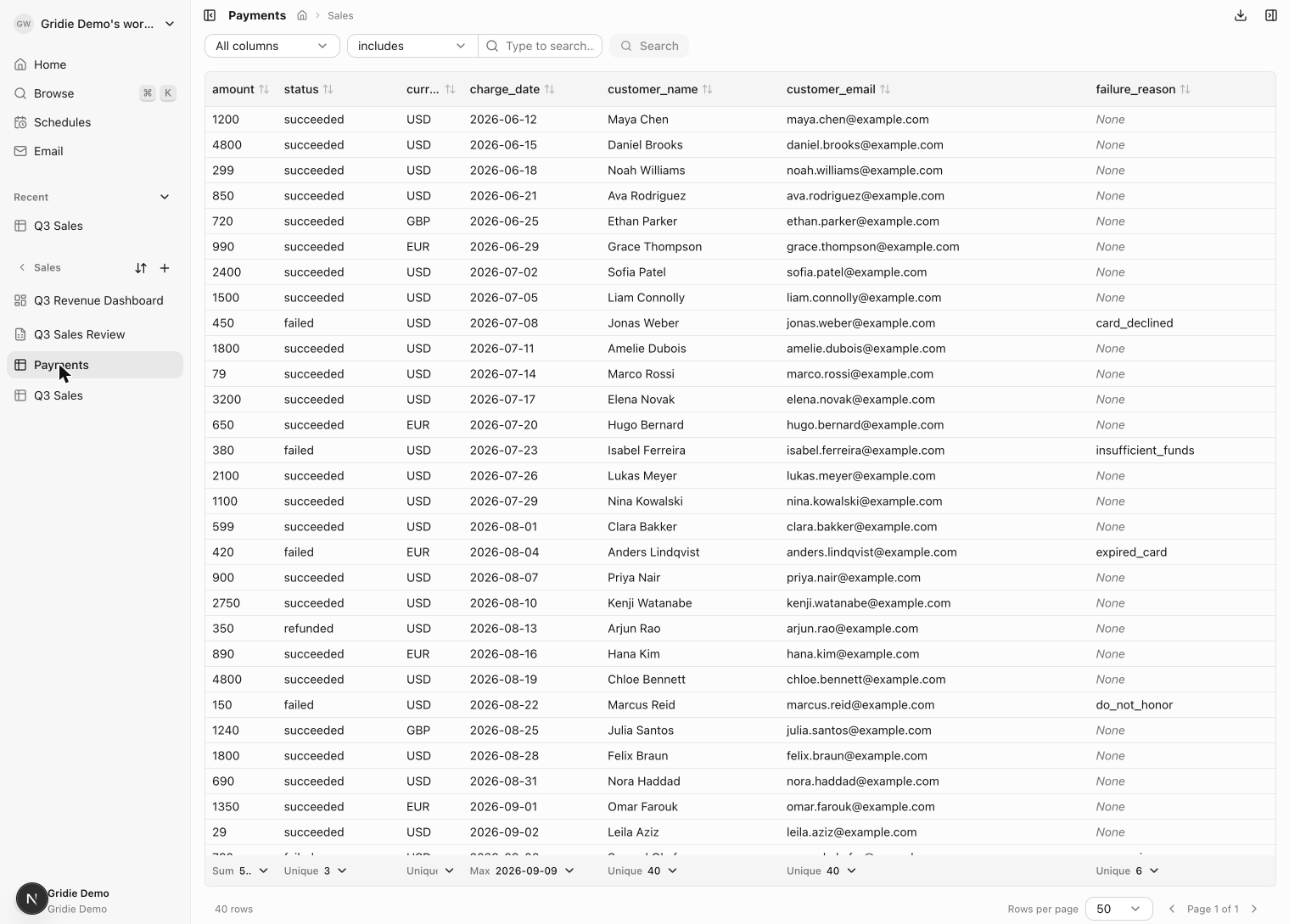
A table has named columns with fixed types. You don’t click into cells the way you do in a workbook — instead you search and aggregate large numbers of rows quickly. → Learn about tables
Step 2: Ask for Aggregations in Plain Language
Table data is queried with SQL, but you don’t have to write it. Describe what you want and the agent writes the query, runs it, and shows the result.
Monthly Revenue Trend
"From the payments table, show total amount and count by month."Top Customers
"List the top 20 customers by total payment amount.
Include their payment count, first payment date, and last payment date."
Failure Diagnosis
"Group failed payments by failure reason,
and show what percentage of all failures each reason accounts for."
Find Churned Customers
"Find customers who paid last month but have no payment this month."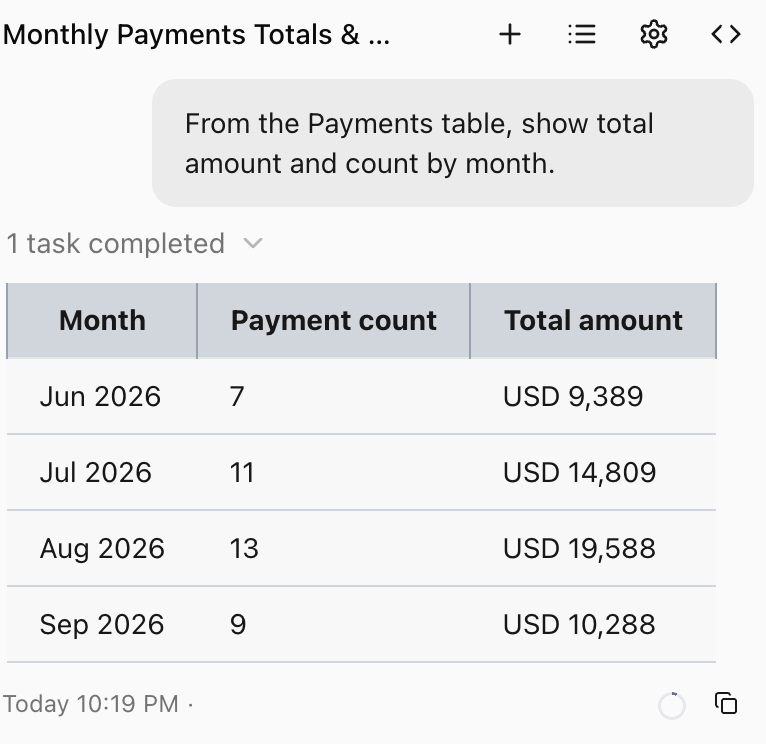
If you find yourself asking the same question repeatedly, ask the agent to save that query as a workflow. From then on one run gives you the same result. → Create a workflow
Step 3: Keep the Data Current
Payments keep coming, so the table needs to keep filling. Save the import as a workflow and put it on a schedule.
"Create a workflow that adds yesterday's Stripe charges to the payments table.
Name it 'Payment Data Sync'."
"Schedule the 'Payment Data Sync' workflow to run every day at 6 AM."Step 4: Take the Results Out as a Deliverable
A table is built for storing and querying, not for producing formatted documents. Move finished results into a workbook or a page.
- To a workbook: Use the Export menu at the top of the table viewer to turn the current data into a new workbook. If a filter is applied, only the filtered rows go out. Use this when you want cell formatting and charts to finish a report.
- To a page: For a report you share in the same format every month, a page works better. It arranges metric cards and charts as a dashboard, and it redraws when the data changes.
"Create a payments overview page from the payments table.
Include a monthly revenue trend chart, a top customers table, and failure reason breakdown."
→ Build and share a team dashboard page
Tip: When you’re unsure where data belongs, decide by row count. Hundreds to a few thousand rows where formatting matters means a workbook. Tens of thousands of rows, or data you need to join with something else, means a table. → Workbook vs. table