Page
A page turns the numbers piling up in your workbooks and tables into charts, tables, and text that anyone can understand at a glance, as a report or dashboard. Build a report, and once it’s done, publish it to the web with a link or export it to PDF to share it.
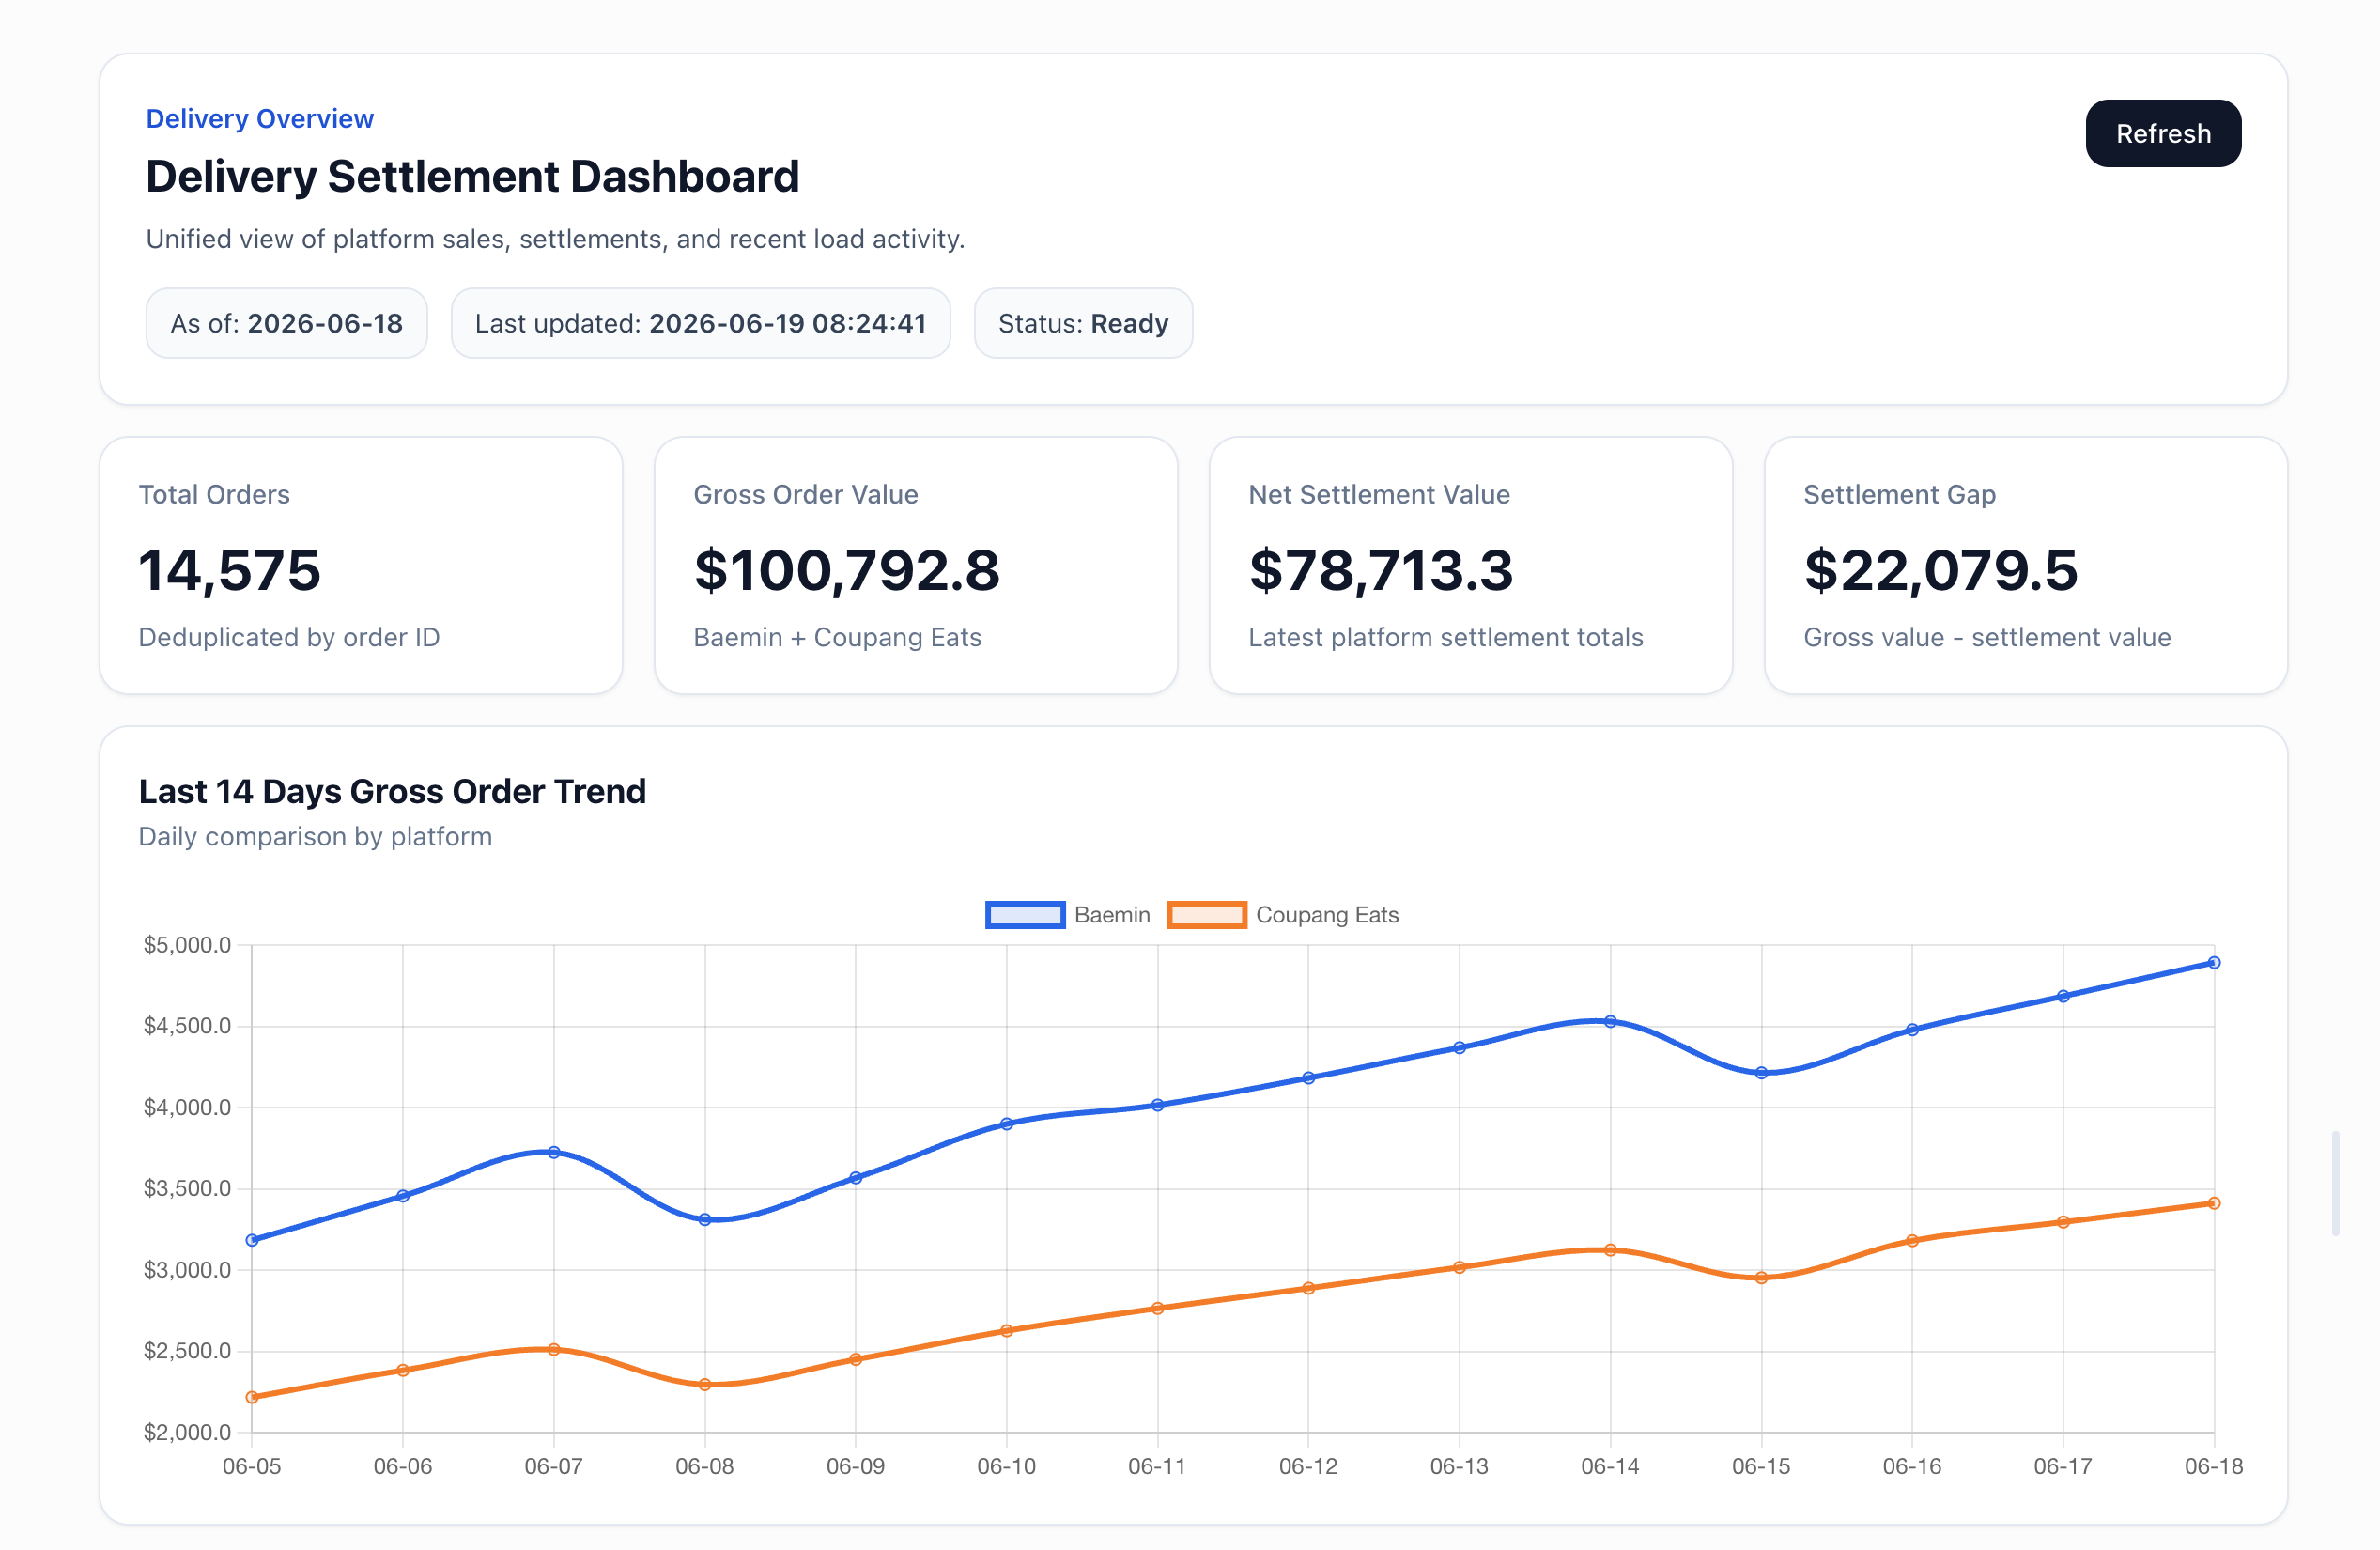
What Is a Page?
A list of numbers on its own doesn’t say much. The same sales figures, drawn as a bar chart, instantly show which region is outselling the rest; laid out as a table, they’re easy to compare line by line. A page pulls in data from your workbooks and tables and lets you arrange charts, tables, and text freely in a grid — making it far easier to give raw numbers meaning.
- A workbook is a workspace for editing data cell by cell.
- A table is a dataset for storing and querying data.
- A page is a report that visualizes that data so anyone can understand it.
Think of it as the presentation and sharing surface for your data, not a place to change the underlying data. From a table in your workspace, pull it into a workbook if you want to click into cells by hand, or into a page if you want it laid out as a polished, shareable report.
Building Pages Through the Agent
You create and refine pages by telling the agent what you want in plain language.
- Lay out the page: Ask “Put a sales trend chart and a table by region on one screen” and the agent arranges sections in the grid.
- Visualize data: Pull data from a table or workbook and render it as charts and tables.
- Edit and refine: Adjust section by section with requests like “Change the chart from bars to a line” or “Add a summary sentence at the top.”
Pages redraw when their data changes, so they work well as a recurring report format you reuse over time.
Finish the Report, Export to PDF
Build a finished document, such as a sales report or a weekly update, as a page, then click the Download PDF button at the top to save it as a PDF file. Handy for sharing or archiving reports. Downloading the PDF is for subscribers.
Publish to the Web with a Link
Click the Share page button at the top of the page and the share panel opens right below it. Click Create share link to publish the page to the web, then use Copy link to copy the address and send it. Anyone with the link can view the page without signing in.
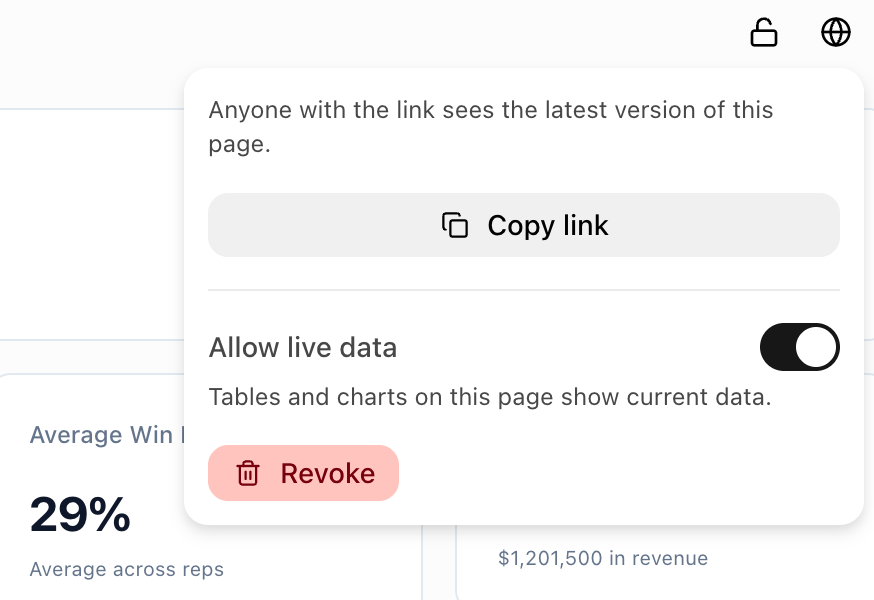
The public link shows the page itself, not a copy. When the agent or a teammate edits the page, the change shows up on the link right away, so one link you send out can stay the address of a recurring report.
- Allow live data: Tables and charts on the page show current data. It starts turned on when you create the link.
- Revoke: Takes the page off the web. To publish it again, create a new link with Create share link.
Anyone who can edit the page can create a share link, and the person who created the link is the one who changes its settings or revokes it. The link shows the page for as long as its creator can view that page. Buttons that run workflows work when the page is opened inside Gridie.
Preventing Accidental Edits with Locking
Once a page is finished, lock it to prevent accidental changes. Click the Page lock button at the top of the page to lock it, and click it again to unlock. A locked page cannot be modified, not even by the agent, so unlock it first when you need to make changes.
Lock dashboards you share regularly and finalized reports to keep them safe.
Restoring a Deleted Page
When you delete a page, it moves to the trash and is kept there for 30 days. Click Undo in the notification that appears right after deleting, or go to User menu → Settings → Workspace → Trash and click Restore to bring the page back. After 30 days it is deleted automatically.