Table
If a workbook is an Excel file, think of a table as one sheet inside the database that data lives in. Instead of editing cells one by one, a table holds thousands to millions of rows and lets you pull out just what you need through chat. Internally, it runs on a database language called SQL. Developers write SQL directly, but in Gridie, you can talk to the agent and ask for what you need from the database without writing SQL yourself.
What Is a Table?
Say you have 100,000 rows of order data coming in every day. Put that in a workbook (spreadsheet) and the scrolling never ends and everything slows down. Put it in a table instead, and you can ask something like “Show me last week’s sales in Seoul” through chat and get exactly the slice you need. If a workbook is a tool for building visible documents with formatting and formulas, a table is closer to a warehouse — it stores large amounts of data in named columns and searches/aggregates it fast.
To be precise, a table isn’t itself a database. Each workspace has a database that holds many tables, and what Gridie calls a “table” is one of those tables inside it. From there, a table branches two ways — pull it into a workbook if you want to click into cells by hand, or into a page if you want a polished report to share. You can hand off both tables and workbooks to the agent in chat just the same; the difference is that only a workbook lets you click into cells yourself.
SQL (Structured Query Language) is the language you use to ask a database “show me this.” In Gridie, you don’t write SQL yourself — just type what you want in chat, and the agent translates it into SQL and runs it for you. Curious about SQL itself? Read the official PostgreSQL documentation .
Workbook vs. Table: Which to Use
Reach for a table when:
Too many rows
Cram tens of thousands of rows into one sheet and scrolling and searching both grind to a halt. Orders, logs, and survey responses that keep growing belong in a table.
Slow just to open
The more rows a workbook has, the longer it takes to load every time you open it. A table only pulls in what you actually need, right when you ask.
Can’t connect them
Wiring two workbooks together with formulas is a hassle. A table joins different datasets easily, so you can just ask for “total order value per customer.”
Reach for a workbook when:
Polished and visible
Color cells, merge them, and add formulas to make something that looks finished, like a report or a quote.
Small data is fast
A few hundred to a few thousand well-organized rows open and calculate far faster in a workbook.
Straight into a chart
Formatting, conditional formatting, and charts — anything that needs visual polish — happens right in the workbook.
| Criteria | Workbook (Excel) | Table (a table inside a database) |
|---|---|---|
| Pros | Intuitive and easy to learn | Handles almost everything Excel does, and is far more powerful with large or complex data |
| Cons | Gets slow as data grows (low performance), struggles with complex processing, hard for multiple people to work on at once | To use it well, you need to know the SQL query language and have data-modeling skill |
All of a table’s power, none of the learning curve. Using a database properly normally means learning SQL and data modeling. In Gridie, the agent does that part for you — just say what you want in chat, and it’s translated into accurate SQL and run for you, so there’s less to learn and less room for mistakes.
The two work well together across the stages of a data task. For example, keep large source data in a table, then pull just the part you need into a workbook to format it into a finished report.
Creating a Table
Click New table in the sidebar and you get two ways in.
- Start from a prompt: Describe what you want to keep track of and which details matter, and the agent designs and creates the table. Something like “I want to track who borrowed which equipment and when, with the due date and status” is enough. You can also ask it to fill in sample rows.
- Pick a job-based example: Choose a ready-made schema and it is created right away. Examples cover areas like sales, orders, inventory, and accounting, and you can pick just the tables you want from a set.
Job-based examples create a fixed schema, so the same example always produces the same columns. That means you can rely on those column names later in dashboards and workflows.
Viewing and Editing Data
A table opens with two tabs, Data and History. The numbers next to them are the total row count and the number of recorded changes.
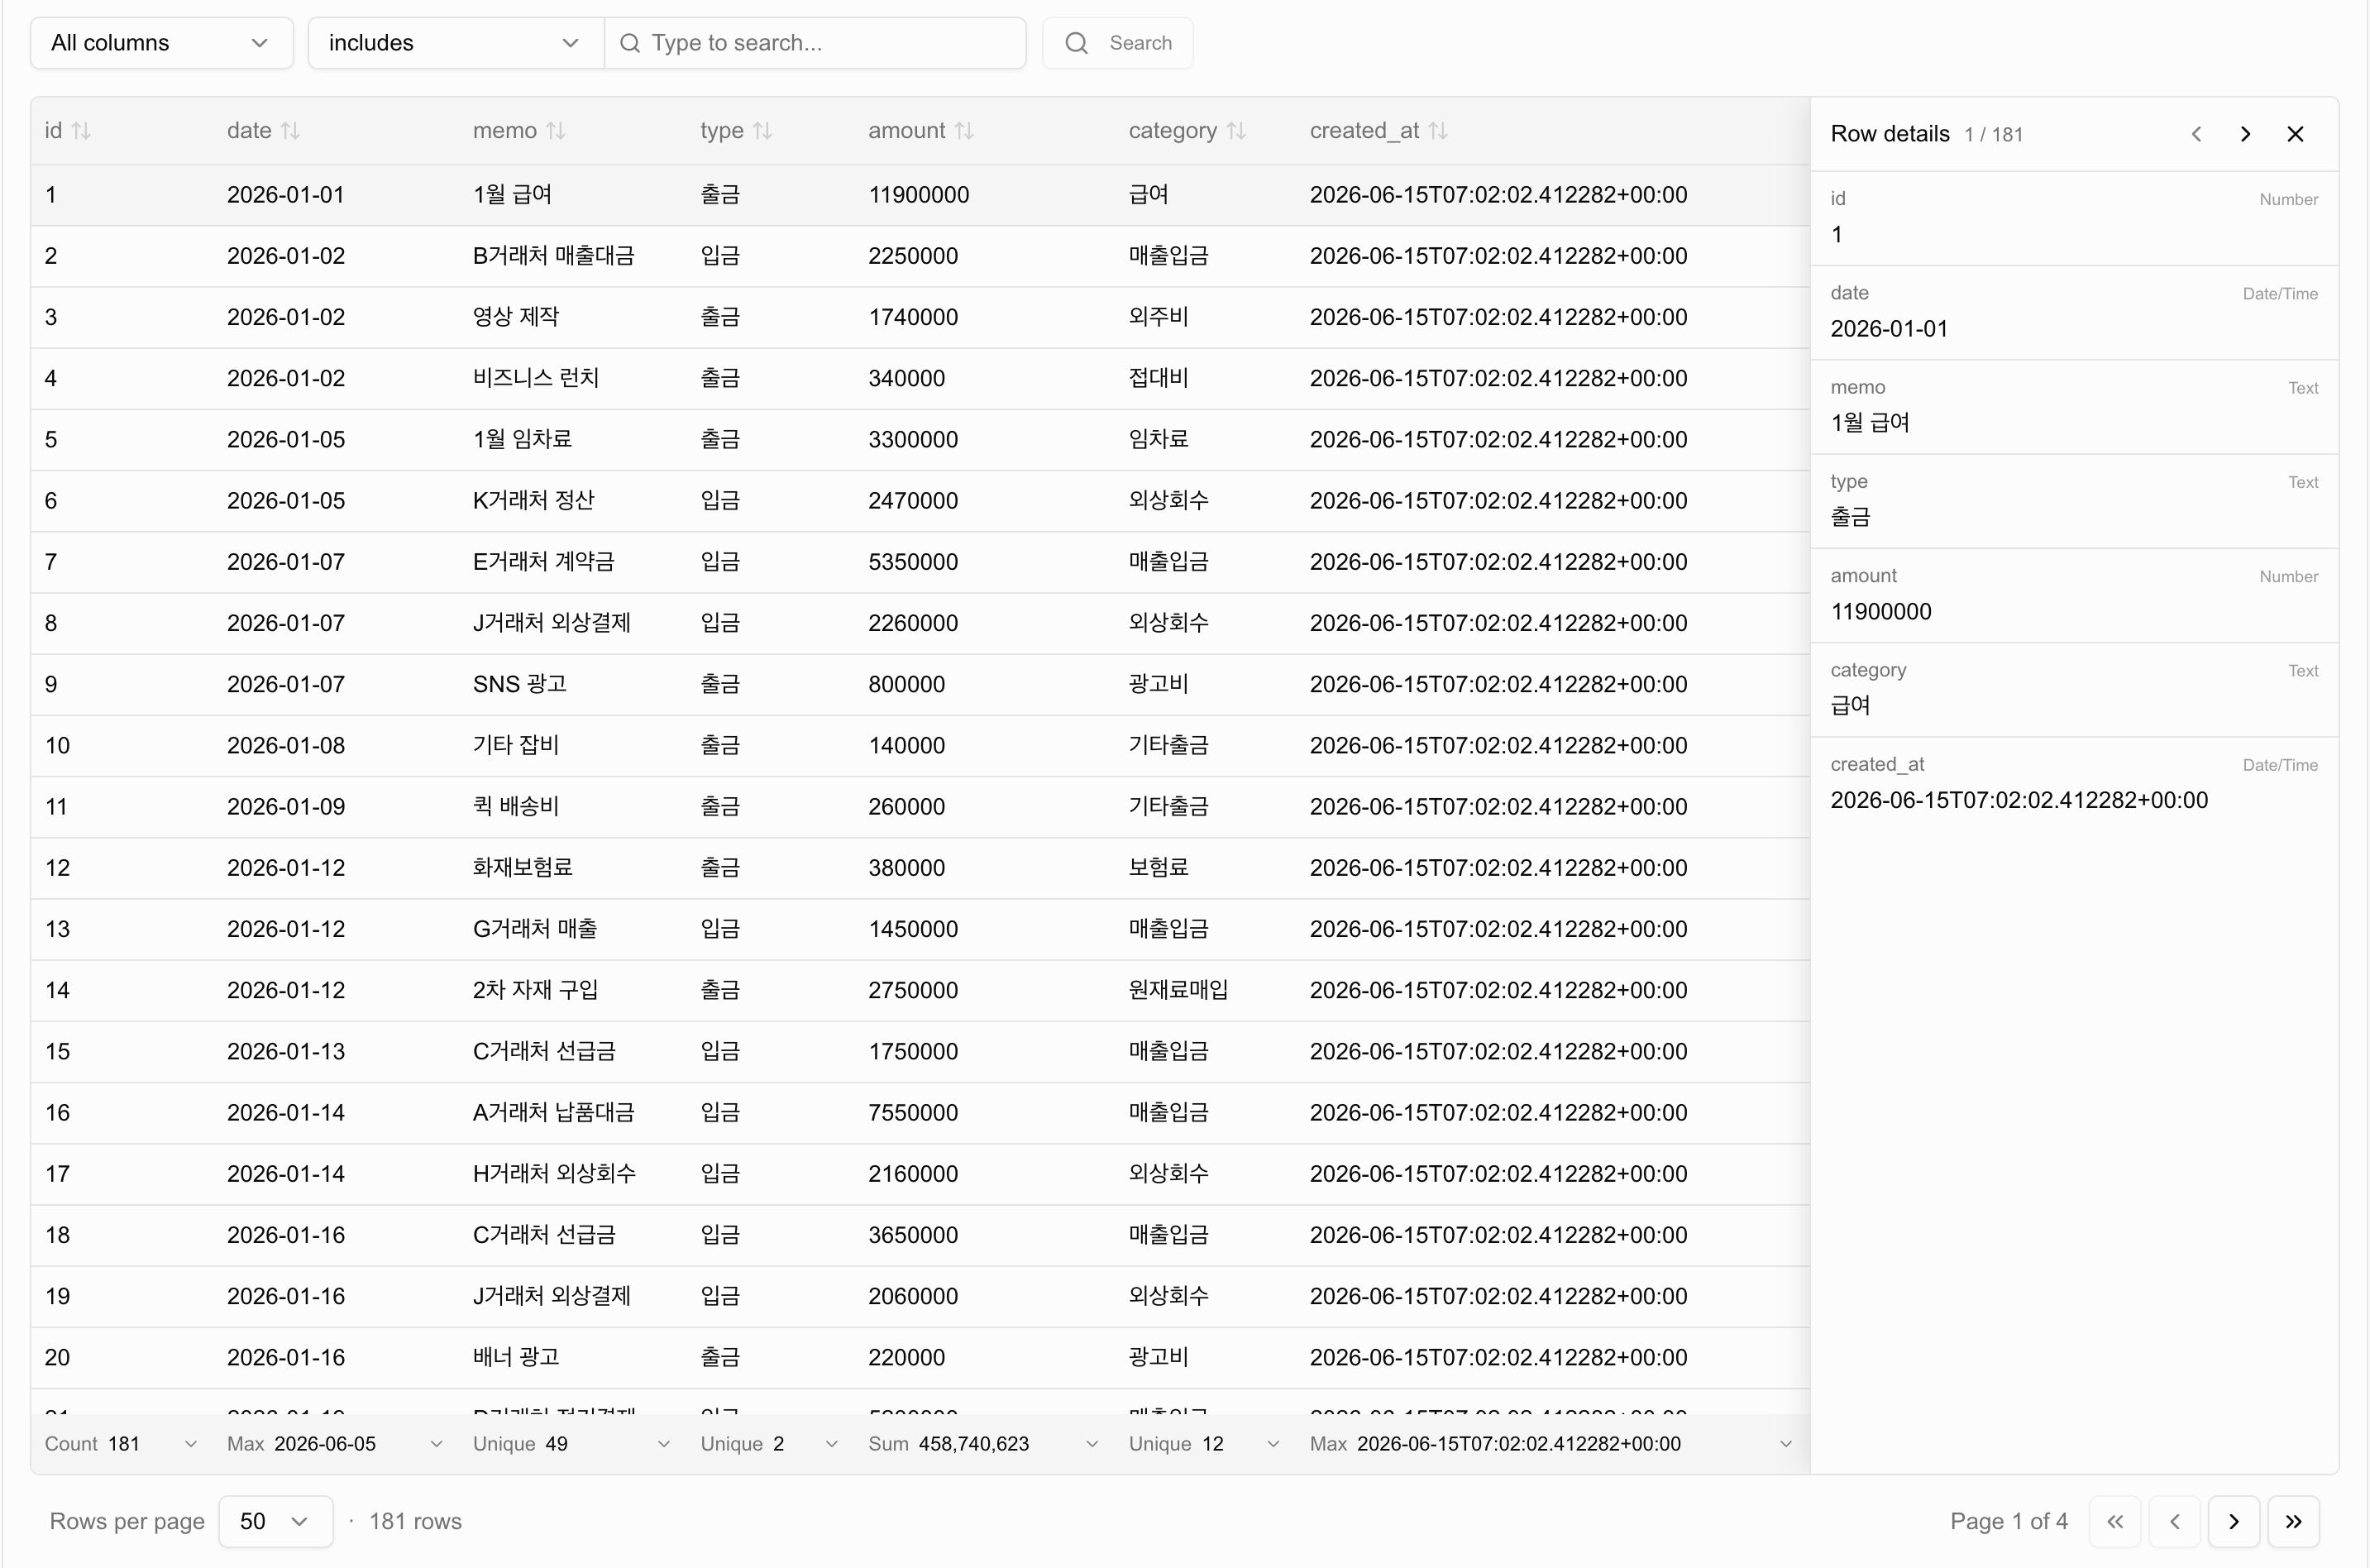
The Data tab shows each value in a way that fits its kind. Numbers line up on the right with thousands separators, and true/false values show as a check or a dash. Text columns that repeat a handful of values, like a status or category, are colored as tokens, and links, emails, and phone numbers open with a click. A value that points to a row in another table gets an arrow next to it; click it to jump to that table with the row opened.
- Filter to the rows you want: Pick a column, a condition, and a value in the single search bar at the top. As you type a value, it suggests values that actually exist in that column, and typing without picking a column searches every column. Filters stay in the search bar, and you can click one to change it.
- Resize columns: Drag the right edge of a header to widen or narrow it. You can also focus the edge and use the left and right arrow keys, and double-click it to go back to the original width.
- See a whole row: Click a row to open the Row details panel with every value in one place, and step to the previous or next row from there.
- Export several rows: Tick the checkboxes in front of rows and a selection bar appears at the bottom. Under Export, choose Create as workbook or Download as CSV for just those rows.
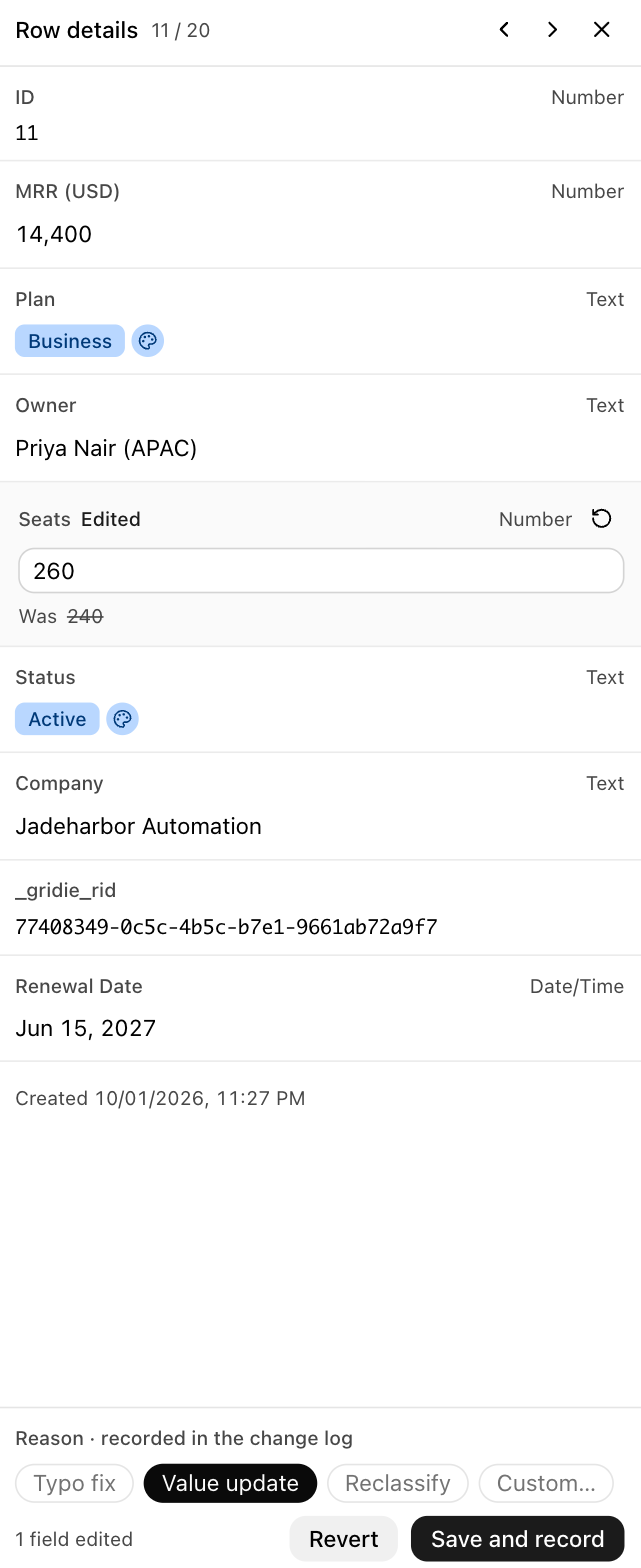
With write access, you can edit values right in the Row details panel. Click a value to turn it into an input; each edited field is marked Edited and shows what it Was, so you can check the change before saving. Pick a reason (typo fix, value update, reclassify) or write your own, then click Save and record, and the reason is saved as a note in the History tab. Click Revert to throw the edits away. You can also pick a color for each value with the color button next to a token. Editing values requires the table to have a primary key.
Viewing Change History
The History tab collects every change made to the table, grouped by date. Changes the agent made in chat, changes from workflows and schedules, edits made in the Row details panel, and writes through the API all show up here. Each entry shows the kind of change, the time, how many rows it touched, and who made it through which path.
- Search: Type into the search bar to find records or SQL, or add conditions for Period, Trigger, Rows affected, Actor, Action, and Memo. For the period, you can pick Today, Last 7 days, or Last 30 days in one click.
- Look at the details: Select an entry to open its note, rows affected, and Changes on the right. Changes lines up each row’s value before and after the change. When the agent changes data it leaves a note on why, shown as Memo · agent.
- Go back to the conversation: If the change came from chat, click Open chat to open the conversation that made it.
- Take out the SQL and changes: From the More menu at the top right of the details, choose Copy executed SQL or Export changes as CSV.
- Export records: Downloads every record matching the current search as a CSV file.
Restoring a Deleted Table
When you delete a table, it moves to the trash along with its data and is kept for 30 days. Click Undo in the notice that appears right after deleting, or go to User menu → Settings → Workspace → Trash and click Restore to bring the table back. After 30 days it is deleted automatically.
Other Things You Can Do
- Give columns display names: If the column names are hard to read, give each column a friendlier display name. The underlying column name stays the same and only the on-screen label changes.
- Organize with folders: Like workbooks, tables can be dragged into folders from the sidebar, with permissions set at the folder level. Tables you don’t have write access to show up as read-only.
- Export elsewhere: The Export menu to the right of the search bar in the Data tab turns the current data (or filtered results) into a new workbook, or downloads it as a CSV file. Anyone can create the new workbook; downloading the CSV is for subscribers.
- Connect outside systems: Click API access at the top of the screen to open this table to the external API and copy its endpoint. See REST API for how to make requests.